Make no mistake: Americans have heavily invested in the lottery over the years, and the total spend has increased in recent years in some states. Researchers from LendingTree reexamined the results of a nationwide lottery study conducted in 2022, and in poring over the data, found several trends and tidbits of information embedded within.
For example, people living in Massachusetts – where a new $50 scratch ticket recently debuted – spend and lose the most on lottery games, while folks from Ohio are the most likely to make their money back.
In this article, Lottery Geeks looks deeper into the study’s key findings and attempts to add further context to the results.
Researchers explain methodology
To find out consumers’ per-capita lottery spending, LendingTree’s researchers analyzed ticket sales (excluding commissions) in 2021 by state. Those researchers then added the estimated commissions that participating stores receive for selling a winning ticket. The rate they set was 5.5% based on available data. However, commission rates will vary by state.
Researchers also divided lottery prize payouts per capita by lottery sales per capita to determine the share that consumers won. To determine the amount consumers lost, researchers subtracted lottery prize payouts per capita from lottery sales per capita. They also looked at lottery sales and losses per $1,000 in personal income in the state. When the tabulations were complete, some interesting findings stood out. Here is a sampling.
Shipping out to Boston
Lottery players in Massachusetts wanted all the smoke.
The researchers wrote, “Once again, data shows Massachusetts residents outspent lottery players in all other participating states — by far. In 2021 (the most recent data available), lottery sales in the state totaled $6,771,892,000 (minus commissions), or $1,024.91 per resident — more than triple the per-capita spending across the 45 participating states ($320.42).”
Of course, more income means more disposable income, and Massachusetts residents boasted the highest per-capita personal income in 2021. The median household income of $89,026 was 29.0% higher than the national median household income of $69,021. In other words, they were drawing from deeper pockets.
Unlike other states discussed in the study, excluding the five that shirk a state lottery, the Massachusetts State Lottery had a better marketing strategy and more substantial offerings to encourage player spending.
Since lottery playing has been, for the most part, accepted by New England society as a reasonable vice, it is easier for the players to invest a bit in the state’s lottery games for a chance to win a fortune. In fact, players spent $12.44 per $1,000 of personal income in 2021 — more than double the $5.00 spent across all participating states.
The thrill is gone for North Dakotans
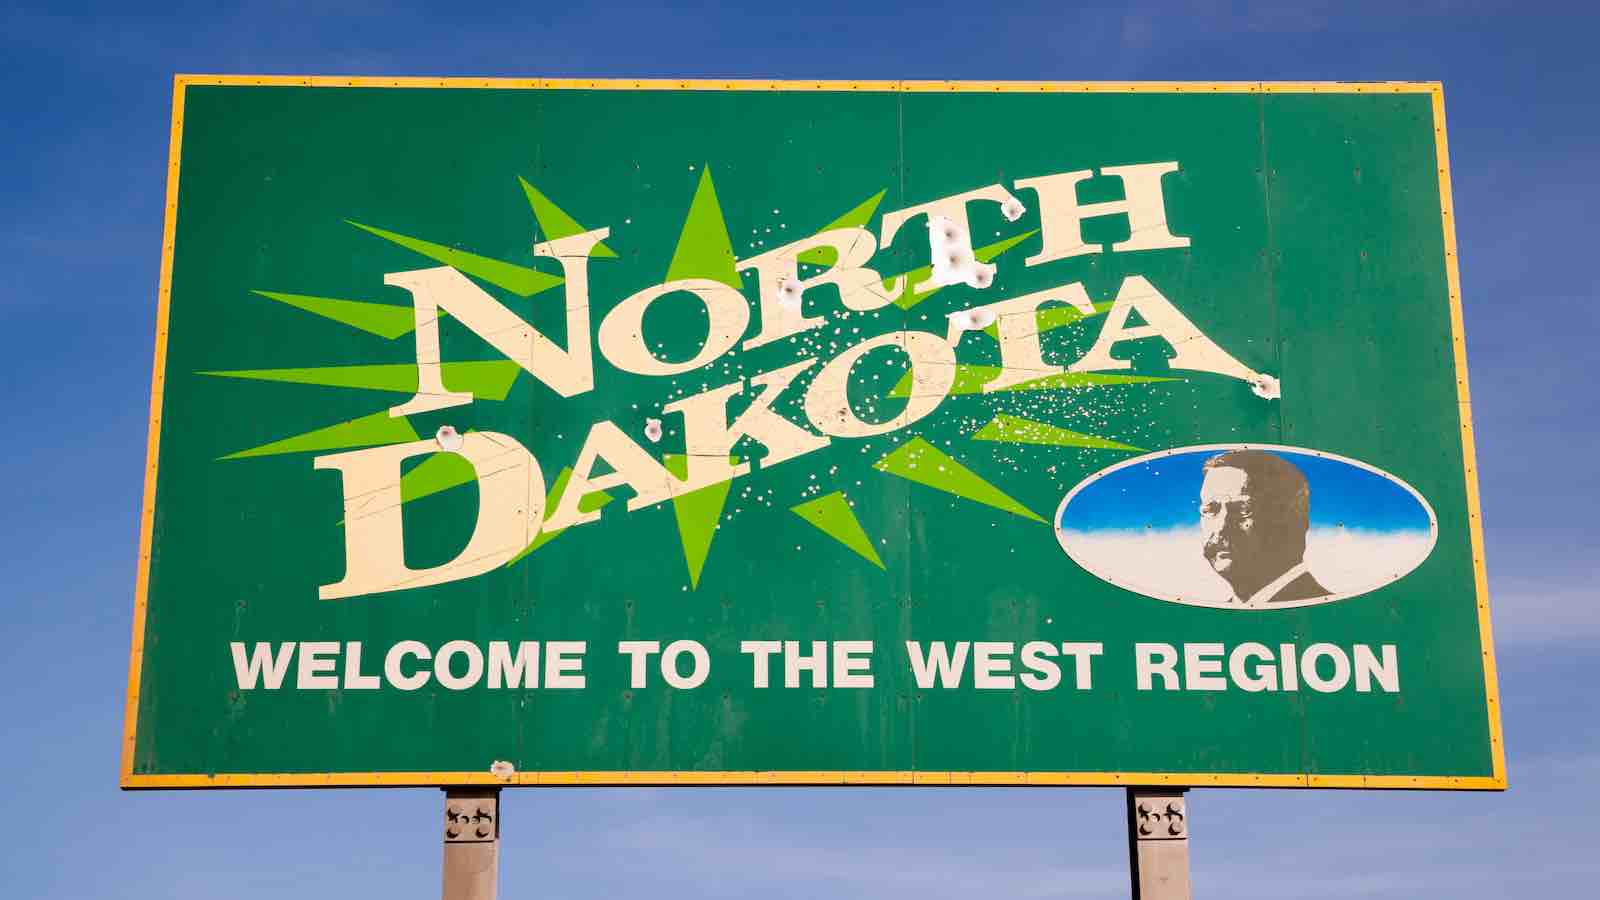
The researchers found North Dakotans were not the biggest fans of the lottery. The players spend way below the national average of $382.70 per capita. North Dakotans only part with $39.74. There is a noticeable gap compared to states like Wyoming and Montana, where residents spent $54.50 and $61.99 in lotteries, respectively. These states ranked in the bottom three in the study year of 2021 and 2020.
These results did not shock the researchers as the 2021 median household income in North Dakota was $68,131, or slightly below the national median household income of $69,021. There’s simply less disposable income.
According to the U.S. Bureau of Economic Analysis (BEA), the regional price parity for North Dakota in 2019 (the latest available data) was 96.4, which means that the cost of living in North Dakota was approximately 3.6% below the national average.
Although the cost of living may be lower than the national average, the census shows North Dakotans prefer to invest their money elsewhere. Two decades ago, people did not even know if they wanted to have a state lottery, and many wanted nothing to do with it. Add in the fact that the North Dakota Lottery has always had problems in marketing its offerings effectively, and the results are not overly shocking.
West Virginians forking over more than fair share
There’s ways to stretch a dollar further in West Virginia than playing the lottery. According to LendingTree’s researchers, West Virginia residents lost more of their income to the lottery in 2021 than other states — $6.47 per $1,000. These losses were more than triple the average across the 45 participating states — $1.82.
The study shows West Virginia is in 13th place in spending per capita on lottery-related services at $392.70 and has historically been a high spender. Academics like Jonathan D. Cohen, author of “For a Dollar and a Dream: State Lotteries In Modern America,” would argue that most of the spending might be from people with some sort of debt they need to pay off. Those people see a big lottery draw and bet more than they probably should, especially with their odds of winning being so drastically low. The actions lead to higher losses.
The suggestion for lowering these losses is better education regarding responsible gambling. Although this advice applies to all 45 states involved in the study, the states with lower economic footing would be much better served to explain to players the downsides of gambling or, at least, restrict how far down the rabbit hole of losses they can go.
Risk and reward
There is a lot of doom and gloom when the media discusses the merits of playing the lottery. While the odds are usually stacked against the average Joe, players can still recoup some of the investment. Of course, some state lotteries share a larger percentage of the pot with the public.
For example, the LendingTree researchers wrote, “Despite ranking 11th for the largest prize payouts per person, Ohio’s lottery players earned back the greatest percentage of their money. Residents in the Buckeye State laid out $336.04 per person and won back $241.43 in 2021, a 72 cents per dollar payout — 12.5% higher than the 64 cents average across all participating states.”
That doesn’t mean everyone comes out looking good, though. Players in South Dakota didn’t win much compared to what they spent. Unfortunately that’s by design in South Dakota, as in two other states. Folks in South Dakota won back only 20 cents per dollar spent — the least of all lottery-playing states. They were followed by West Virginia, which had the second-smallest wins per dollar spent at 22 cents (partly explaining the disproportionately high losses), followed by Oregon at 24 cents.
As the old saying goes, what goes up must come down, and the same can be said for lottery players in Massachusetts. Researchers wrote, “Looking at the prize payouts compared to how much players spent also shows how much they lost. When subtracting winning payouts from estimated sales, we calculated losses of $412.14 for every resident in Massachusetts. That’s far above the $116.55 per resident in the 45 states with lotteries — or even West Virginia and Rhode Island, which had the next-highest losses per capita at $306.47 and $283.54, respectively.”
The rationale for this outcome is that the more the players spend, the more likely they lose. When there are more tickets in circulation, the odds always decrease. Basic math can explain why states like North Dakota ($18.69 per resident), Montana ($21.97) and Wyoming ($24.21) all have the lowest losses. If they are not overly invested in the lottery and fewer tickets are in circulation, it is more than likely that they will not lose as much money as the high spenders.